Copyright 2023 © Tempsee
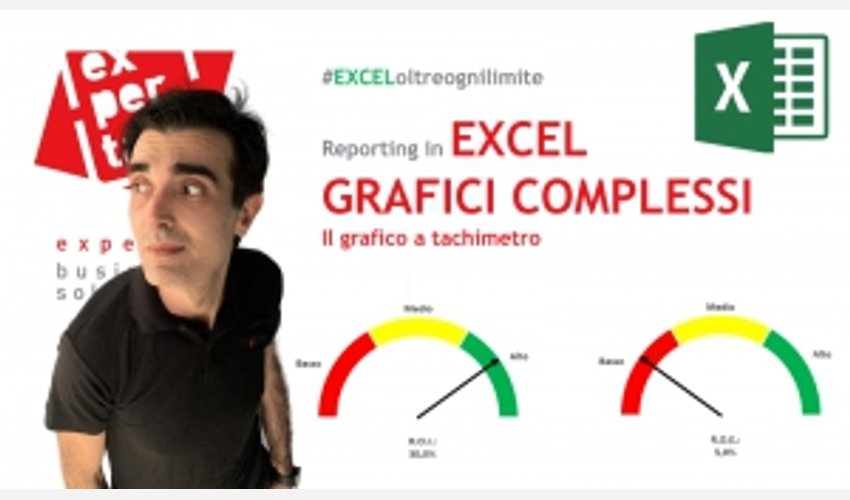
Un grafico a tachimetro (o “speedometer”) è un modo semplice e intuitivo di rappresentare gli indicatori di performance (Key Performance Indicators o KPI). Questo tipo di grafico non è presente tra quelli proposti da Excel, ma ne abbiamo costruito uno che potrai personalizzare secondo le tue esigenze. Per saperne di più, puoi vedere il tutorial che spiega come utilizzare questo template sul nostro canale YouTube, Utilizzo professionale di Microsoft Office: https://youtu.be/Ju78PPIORxk.
Utile se vuoi:
- Creare una dashboard evoluta per monitorare i dati e prendere decisioni strategiche
- Rappresentare in modo veloce e intuitivo, “a colpo d’occhio” lo status di un KPI
- Rendere più efficace una presentazione
🇬🇧 Looking for this chart in English? It’s right here on Tempsee, at this link: https://tempsee.com/downloads/speedometer-chart-to-represent-kpis-in-excel


Customer reviews
0.0 out of 5